I had difficulty understanding concepts such as vertexs and edges and bridge etc.
Bridge Testing & OBST
In graph composed of vertex and edge, bridge searching test and The goal is to implement the program that output weight table, cost table, root table, the data needed to implement optimal binary search tree, to the console.
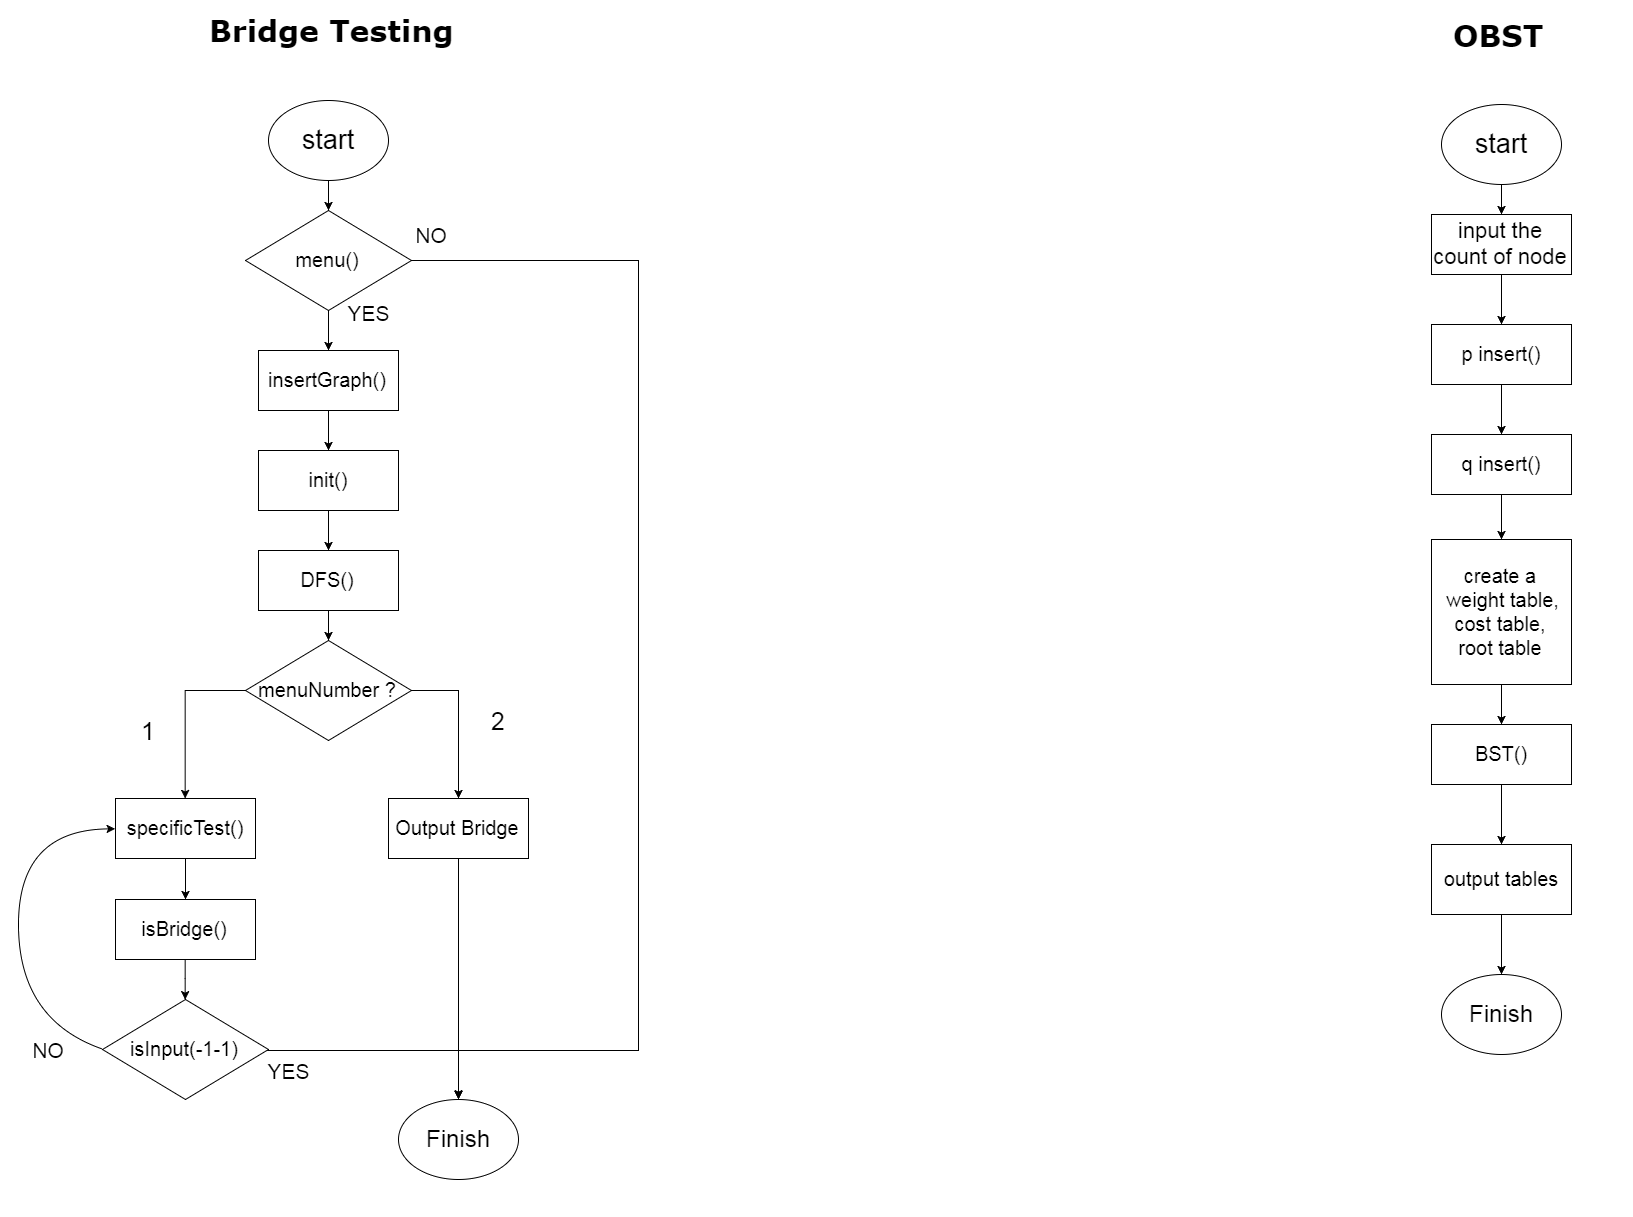
Flow Chart
Specific Edge Bridge Test
Explanation
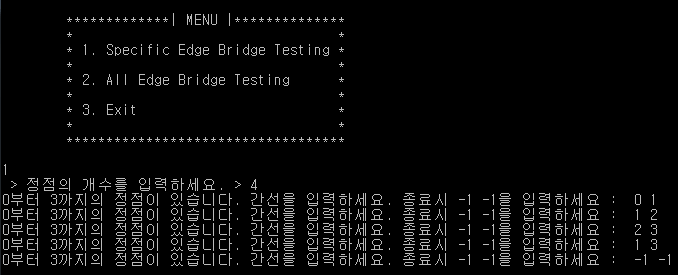
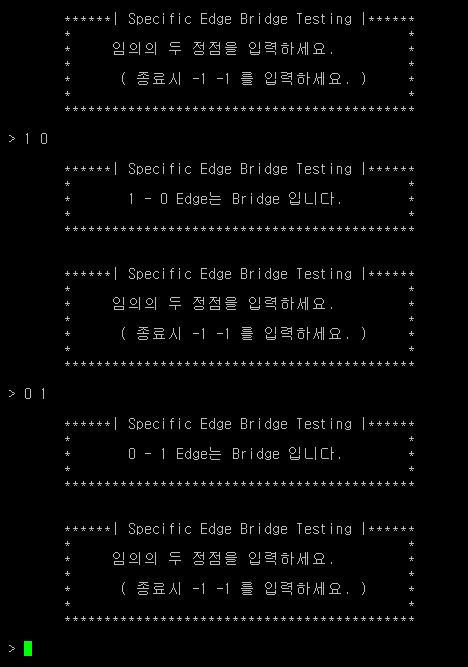
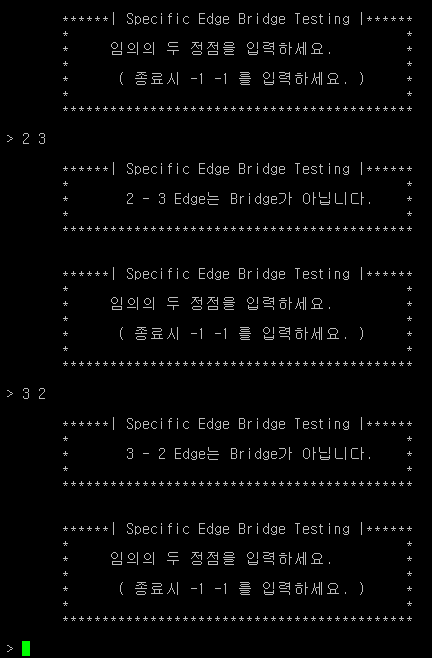
The above capture screen is the first menu, Specific Edge Search Test. As you can see on the screen, the vertex is 0, 1, 2, and 3, and the edge are 0-1, 1-2, 2-3, and 1-3. The graph will look like this.
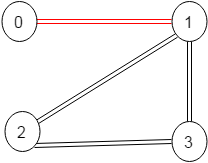
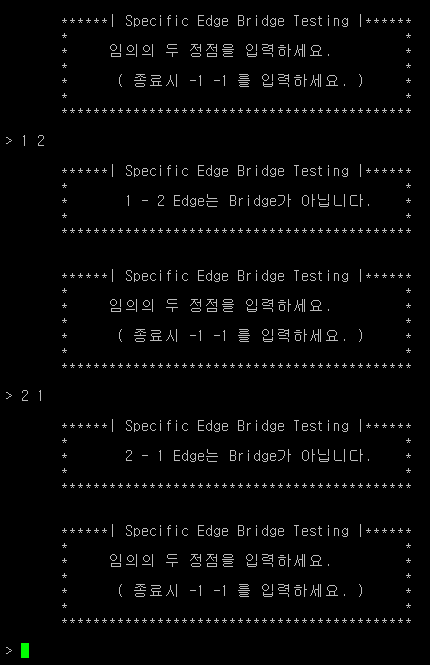
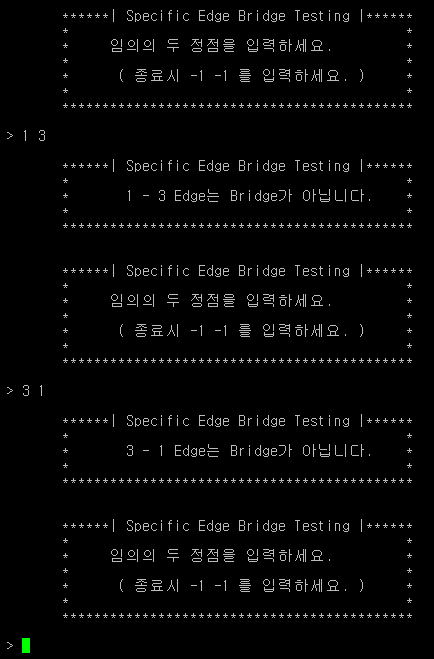
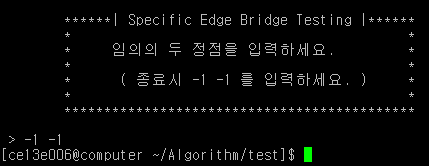
The edge 0 - 1 is bridge here. Therefore, the execution screen also prints the message, " 0 - 1 Edge is a bridge. " For the other edge, print the message " n - m Edge is not a bridge. "
All Edge Search Test
Explanation
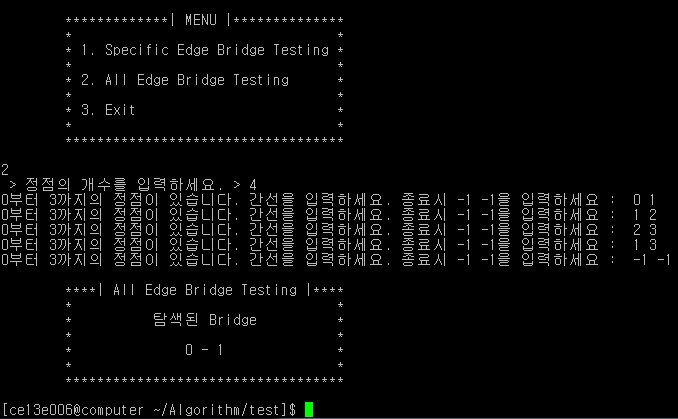
The above capture screen is the screen that ran the second menu, All Edge Search Test. This is what it looks like when you apply the graphs that you ran on the first menu. Let's compare it with the other graphs below.

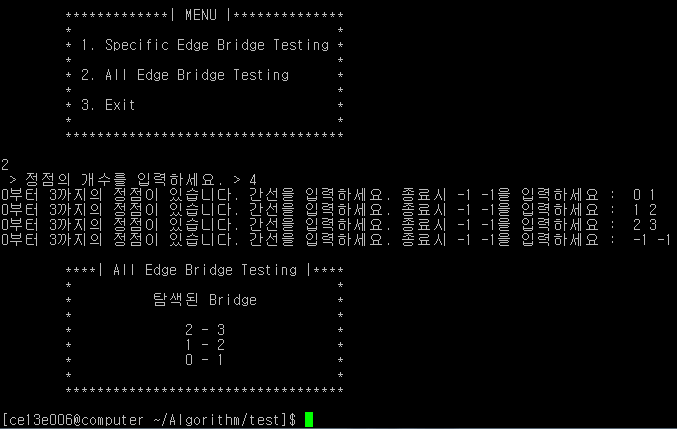
In this case, the following graphs are shown. In such a case, In this case, 0-1, 1-2, 2-3 are all bridge so, You can see all edges printed out on the detected bridge screen.
OBST
Explanation
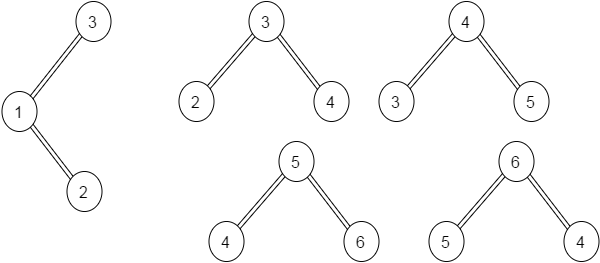
The above capture screen is what it looks like when you run the program. You can see the output of each table. Based on this result, the tree was created in six stages as shown below.

Step 1
Step 2
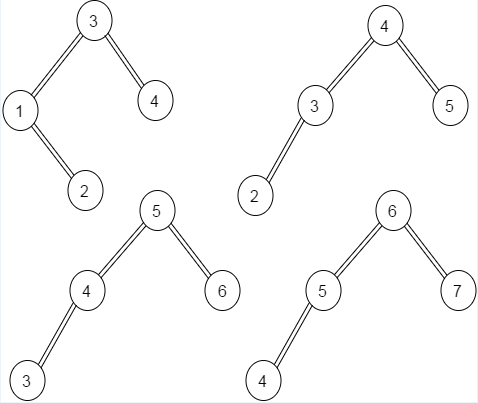
Step 3
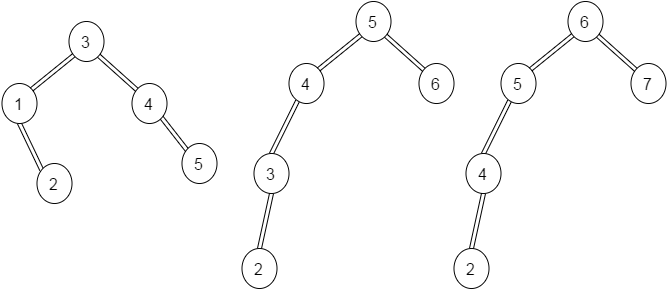
Step 4
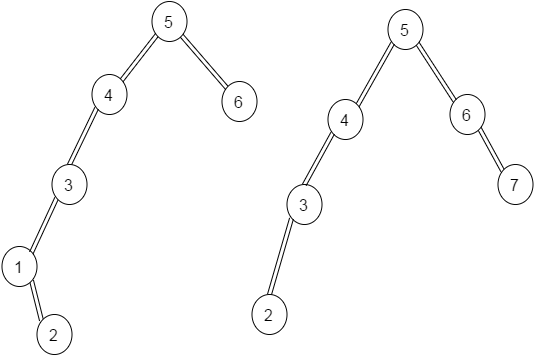
Step 5
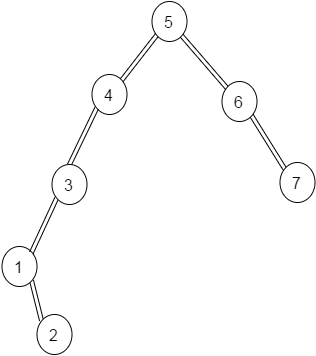
Step 6
My efforts were rewarded
What I learned through this project